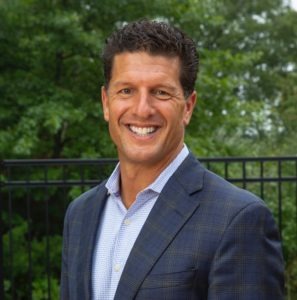
One-on-one with…Chuck Czarnik
Chuck Czarnik, CHDA, is kind of like the Wizard of Oz. He works behind the screen at Brookdale Senior Living to harness the power of machine learning and predictive analytics to turn data into actionable information. As vice president of strategic planning, Czarnik mines the Minimum Data Set (MDS), Admit Discharge Transfer (ADT) and the Outcome and Assessment Information Set (OASIS), among other company and vendor datasets for clinical insights and analytics. Senior Editor Nicole Stempak caught up with Czarnik between sessions at the Long-Term Post-Acute Care and Health IT Summit in Reston, Va., to talk about how Brookdale is using that data to improve patient outcomes and operations.
What are some ways you’re using data to improve business?
We’ve gotten copies of most of our vendors’ databases, and we use that data to answer questions. Let’s say that the vendor’s system may have basic reporting for diagnosis coding but the organization needs something much more refined. We dive into that data and produce a custom analysis. This gives us the ability to ask more sophisticated questions than packaged reporting would allow.
(One team) has built very cool lead scoring models to predict move-in probability for resident prospects. This helps our sales and marketing team focus their efforts. Another team has built a predictive tools focusing on revenue cycle. These aren’t averages of what’s happened. They’re signals to tell us what’s likely to happen.
Are those requests from corporate headquarters or from the facilities?
We get a lot from our corporate team- especially our strategy, finance, and business development folks. Lots of big decisions that affect a big company. We work on a number of reporting issues to support that. There’s not as much field interaction today as I would like to see, but it’s definitely growing. At the end of the day, we want our nurses and our caregivers to be spending quality time with our customers, and part of my job is to minimize the time they spend with the computer.
What do decision makers and caregivers think about the data?
The response has been very positive. We’re spending a good bit of our time today mining our SNF and assisted living assessment data, analyzing tens of thousands of customers for specific clinical and financial factors that used to require manual chart reviews. The labor savings is huge, but I also hope it brings some sanity to the folks who would otherwise be pouring through charts manually.
How does the data drive decisions?
It’s a cyclical model. We’re using data to measure and set targets, but those sort of influence each other. That’s really the essence of being quality-analytics driven. It’s a feedback loop. I will say that the task of figuring out what to measure and how to measure it is not insignificant. I’m finding that for some very important benchmarks (such as re-hospitalization) both our organization (and the industry) often lack both the data and consistent methods to effectively measure.
What’s one lesson you’ve learned?
Answering a question doesn’t usually lead to a conclusion. All it really does is create an appetite for the next answer. So putting the tools in the hands of our associates is key. It took us a while to learn that. I started out in essentially a project role answering a few very narrow questions for the organization. Six years later, there’s (a team of) six people working harder than ever answering an exponentially growing list of questions.
It sounds like you’re becoming the Google for Brookdale.
There absolutely is a tremendous demand.
How is Brookdale approaching self-service data analytics?
That’s a growing focus for the organization. We’re looking at deploying tools and functions that would allow someone in the field who’s not a data scientist or financial planning analyst to get their own answers. (Each team) has its own silos of data—silos built around specific subject areas—clinical, financial, sales, strategy, etc.
The first component is data governance, which is about curating data with standards on how it is stored, secured and measured. For example, with a metric like occupancy percentage, we want to make sure that the entire organization is working with a consistent definition and the source of truth for that measure is known to all. It’s a significant task to catalog and align hundreds of measures.
The second is figuring out how to get that data into the hands of folks that need it. Self-service. And there are some amazing tools out there that make it easier than ever to create some very impressive analyses.
So, your data is used by everyone, but whom do you report to?
We actually report to operations, which is an interesting experiment. When you think about analytics and reporting, usually they’re thought of as IT functions. But the consumer is often in operations. What we’ve found is those two groups of people speak completely different languages. What’s neat about my group is we are IT people who have been brought into and trained in the business. Or, we’re business people who have been brought into and trained in IT. We sit on the fence between those departments and serve a sort of translation function. That’s solved a lot of communication gaps inside the organization.
Any advice for those venturing deeper into data analytics?
The cleaner the data, the better. Production analytics with large data sets requires a lot of attention to how you collect the data in the first place. We can’t do a lot with narratives and progress notes, and we can’t do anything with data locked up in a paper chart somewhere. So there has been a huge influence on the systems that we’ve selected and how they’re used. It’s the “garbage in, garbage out” problem.
What has been your most surprising finding?
There’s a tremendous amount of insight locked up right in the data that most organizations already have. They span clinical to operations to marketing. Be creative and put it to work. That’s where my team spends most of our time, doing things we didn’t know could be done. It’s easy to point at all the data that we don’t have, and we need to work with the industry and regulators to make that available. But don’t overlook the incredibly cool things that can be done with what’s right under our feet.
Nicole was Senior Editor at I Advance Senior Care and Long Term Living Magazine 2015-2017. She has a Journalism degree from Kent State University and is finalizing a master’s degree in Information Architecture and Management. She has extensive studies in the digital user experience and in branding online media. She has worked as an editor and writer for various B2B publications, including Business Finance.
Related Articles
Topics: Articles , Executive Leadership , Technology & IT


